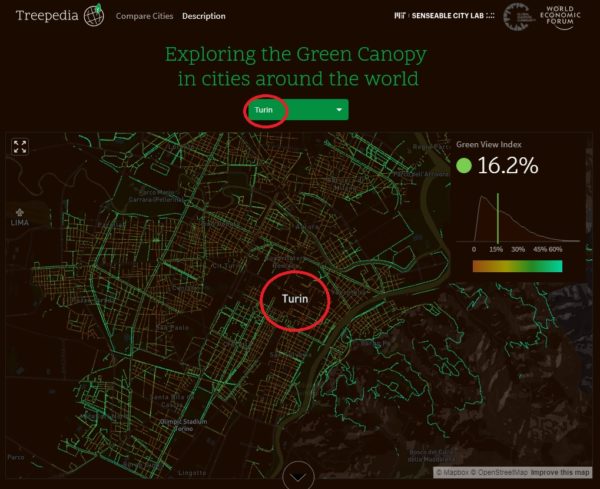
Un confronto molto interessante utilizzando il Green View Index (GVI).
Guarda il sito:
http://senseable.mit.edu/treepedia/
GVI è stimato utilizzando le viste di Google Street View – piuttosto che le immagini satellitari – perché meglio rappresentano la percezione diretta delle persone, dal fronte strada.
A seguire le 27 città del mondo elencate in ordine di GVI.
| Green View Index (%) | Population Density/km2 | ||
| 1 | Tampa | 36,1 | 1.283 |
| 2 | Singapore | 29,3 | 7.797 |
| 3 | Oslo | 28,8 | 4.421 |
| 4 | Sydney | 25,9 | 400 |
| 5 | Vancouver | 25,9 | 5.249 |
| 6 | Montreal | 25,5 | 3.889 |
| 7 | Cambridge | 25,3 | 6.586 |
| 8 | Durban | 23,7 | 2.600 |
| 9 | Johannesburg | 23,6 | 2.900 |
| 10 | Sacramento | 23,6 | 1.800 |
| 11 | Frankfurt | 21,5 | 3.000 |
| 12 | Geneva | 21,4 | 12.000 |
| 13 | Amsterdam | 20,6 | 4.908 |
| 14 | Seattle | 20,0 | 3.151 |
| 15 | Toronto | 19,5 | 4.150 |
| 16 | Miami | 19,4 | 4.770 |
| 17 | Boston | 18,2 | 5.344 |
| 18 | Tel Aviv | 17,5 | 8.353 |
| 19 | Turin | 16,2 | 6.900 |
| 20 | Los Angeles | 15,2 | 3.198 |
| 21 | New York | 13,5 | 10.831 |
| 22 | Cape Town | 13,4 | 1.100 |
| 23 | London | 12,7 | 5.518 |
| 24 | Sao Paulo | 11,7 | 7.913 |
| 25 | Quito | 10,8 | 7.200 |
| 26 | Kobe | 9,4 | 2.783 |
| 27 | Paris | 8,8 | 21.000 |
Treepedia’s team at MIT includes Newsha Ghaeli, Wonyoung So, Xiaojiang Li, and Ian Seiferling. The project was carried out in collaboration with the World Economic Forum’s Global Agenda Council on the Future of Cities and World Economic Forum’s Global Shaper’s Community.
CONTACT:
http://senseable.mit.edu/treepedia/press_material.zip
 nicolanoe.it Un sito dedicato agli spazi verdi e all'ambiente – A site dedicated to green spaces and the Environment


